Contents
1. 配置文件
参考alluxio官方文档:https://docs.alluxio.io/ee/user/stable/en/deploy/Running-Alluxio-On-Docker.html
使用用户自定义网络的方式。Docker Compose配置文件docker-compose.yaml:
version: '3'
services:
  alluxio-master:
    image: alluxio/alluxio:2.4.1
    ports:
      - "19999:19999"
      - "19998:19998"
    volumes:
      - {{localPath}}:/opt/alluxio/underFSStorage
    environment:
      ALLUXIO_JAVA_OPTS: " -Dalluxio.master.hostname=alluxio-master -Dalluxio.master.mount.table.root.ufs=/opt/alluxio/underFSStorage"
    command: master
    networks:
      - alluxio_network

  alluxio-worker:
    image: alluxio/alluxio:2.4.1
    ports:
      - "29999:29999"
      - "30000:30000"
    shm_size: "1gb"
    volumes:
      - {{localPath}}:/opt/alluxio/underFSStorage
    environment:
      ALLUXIO_JAVA_OPTS: " -Dalluxio.worker.ramdisk.size=1G     -Dalluxio.master.hostname=alluxio-master  -Dalluxio.worker.hostname=alluxio-worker"
    command: worker
    networks:
      - alluxio_network

  grafana:
    image: grafana/grafana:latest
    ports:
      - "3000:3000"
    networks:
      - alluxio_network

  prom:
    image: prom/prometheus:latest
    ports:
      - "9090:9090"
    volumes:
      - {{localPrometheusConfigDir}}:/etc/prometheus
    networks:
      - alluxio_network

networks:
  alluxio_network:
    driver: "bridge"
其中:
{localPath}是alluxio本地的存储路径,需要根据自己情况进行设置。{localPrometheusConfigDir}指定了promethus配置文件所在目录的映射路径。
在{localPrometheusConfigDir}下,新建prometheus配置文件prometheus.yml,内容如下:
# my global config
global:
  scrape_interval:     15s # Set the scrape interval to every 15 seconds. Default is every 1 minute.
  evaluation_interval: 15s # Evaluate rules every 15 seconds. The default is every 1 minute.
  # scrape_timeout is set to the global default (10s).

# Alertmanager configuration
alerting:
  alertmanagers:
  - static_configs:
    - targets:
      # - alertmanager:9093

# Load rules once and periodically evaluate them according to the global 'evaluation_interval'.
rule_files:
  # - "first_rules.yml"
  # - "second_rules.yml"

# A scrape configuration containing exactly one endpoint to scrape:
# Here it's Prometheus itself.
scrape_configs:
  - job_name: 'alluxio master'
    metrics_path: '/metrics/prometheus/'
    static_configs:
    - targets: ['alluxio-master:19999']
  - job_name: 'alluxio worker'
    metrics_path: '/metrics/prometheus/'
    static_configs:
- targets: ['alluxio-worker:30000']需要注意scrape_config下的参数设置:
- 因为后面会使用
alluxio官方的grafana配置,里面默认的job_name是alluxio master和alluxio worker,所以这里也这样进行设置。 alluxio暴露prometheus度量指标的路径是/metrics/prometheus/,并不是默认的/metrics/targets根据docker-compose.yaml中的设置进行设置的,对应alluxio的服务地址。
2. Grafana配置
在docker-compose.yaml文件所在路径下,执行docker-compose up -d,即可启动所需的服务。
浏览器访问: http://localhost:3000/,可以看到grafana的界面,默认用户密码admin:admin。
2.1 配置prometheus数据源
configuration->Data Sources->Add data source
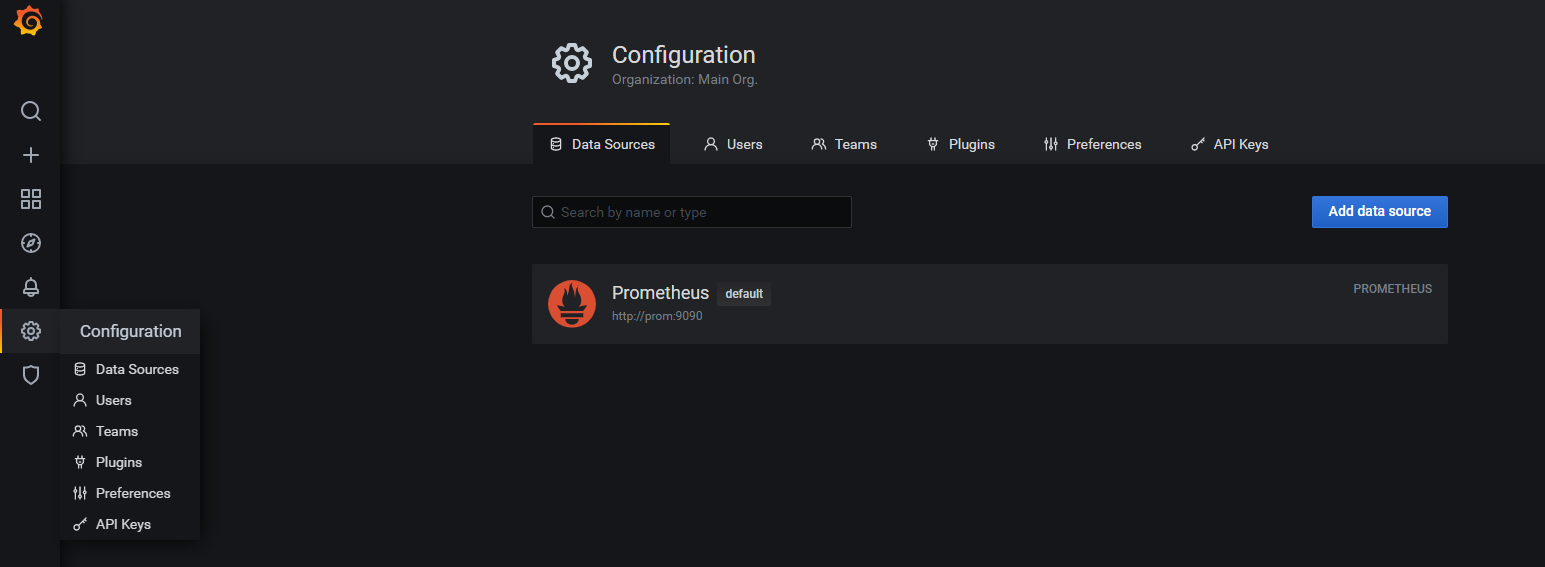
根据之前docker-compose.yaml文件中的设置,设置prometheus的服务访问url。
其他设置可以不动,点一下test and save,确保可以访问到。

这样,grafana的数据源就配置好了。
2.2 导入alluxio官方看板
参考:https://grafana.com/grafana/dashboards/13467
alluxio官方给定的看板配置序号是13467。
操作路径: Dashboards->manage->import
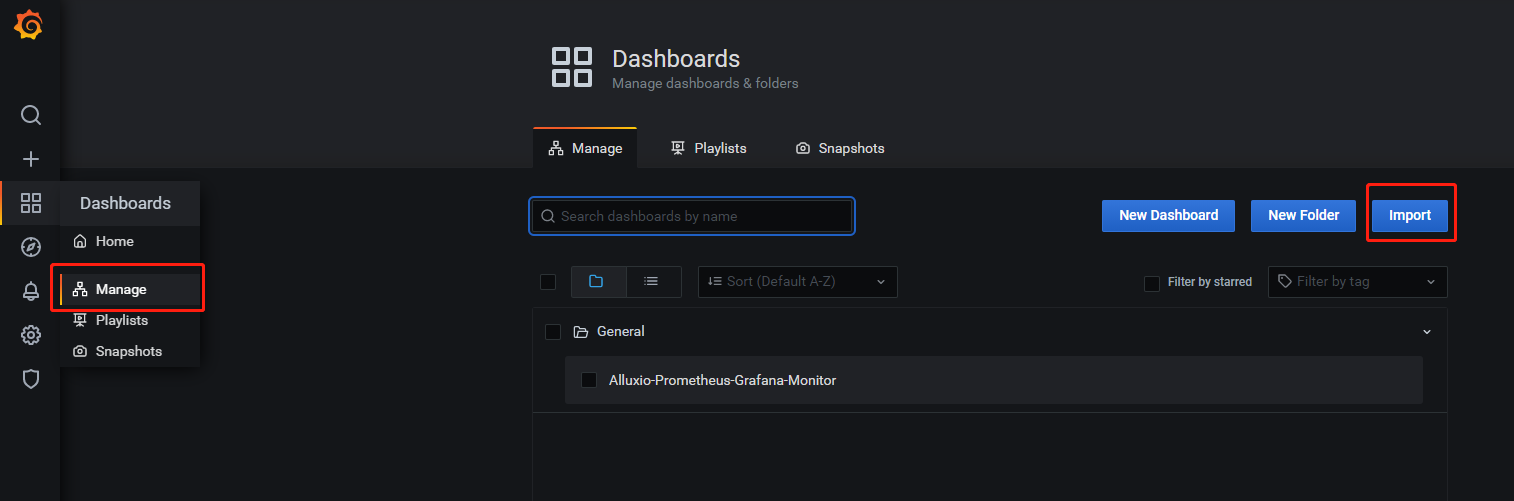
指定序号,然后导入
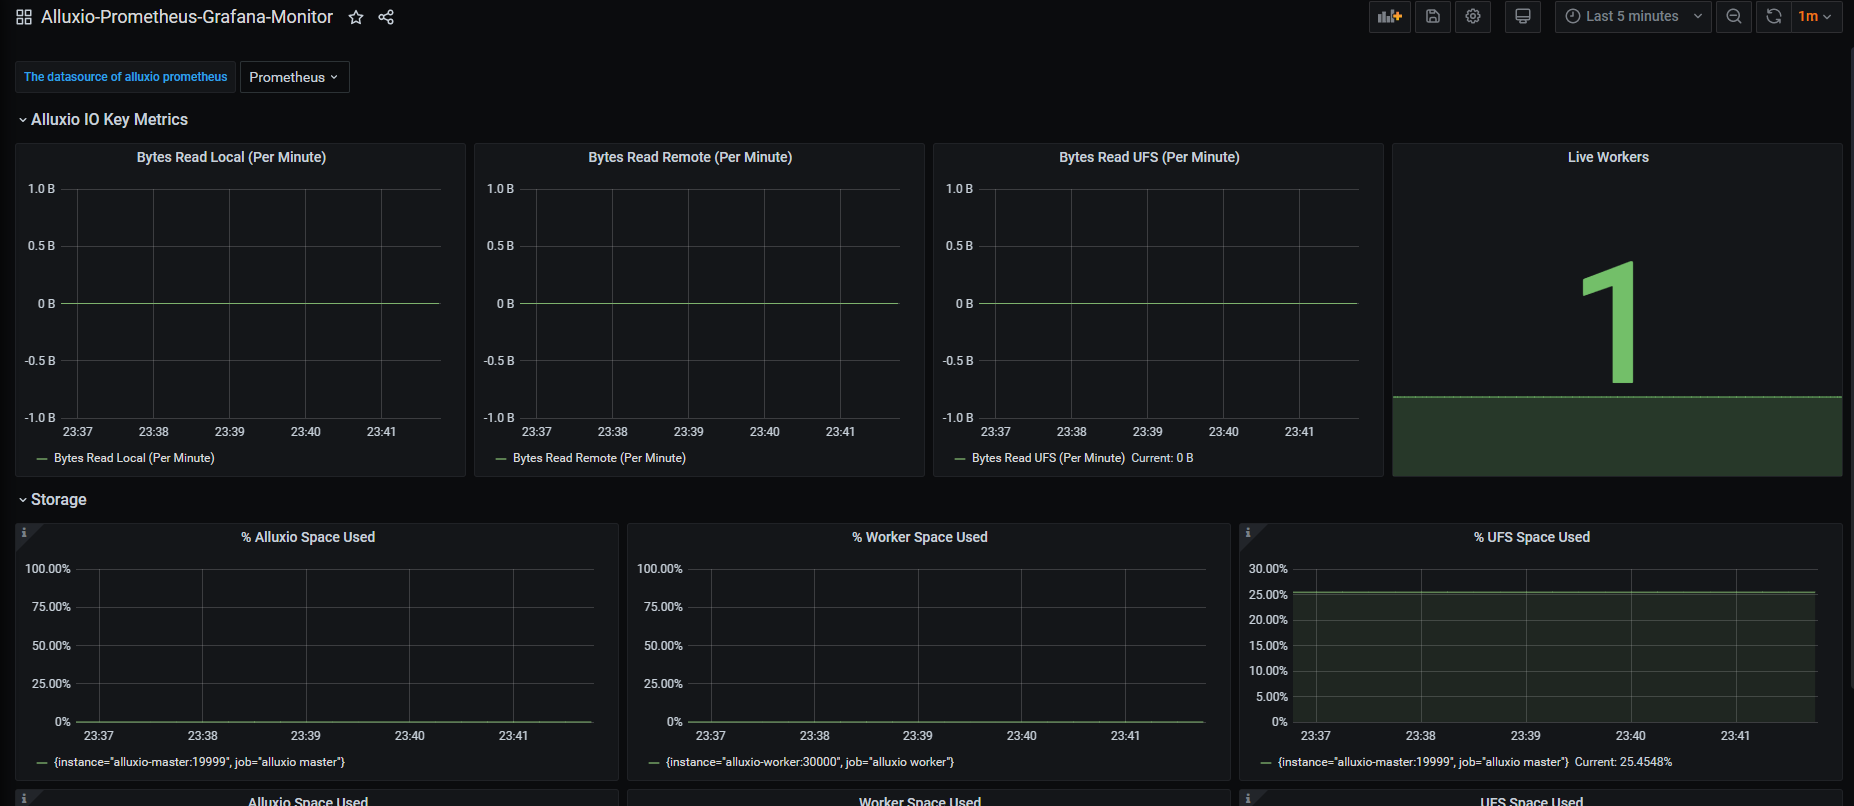
返回dashboard的home路径,即可看到alluxio的看板:
发表回复
要发表评论,您必须先登录。